


Datadriven decisionmaking was once the exclusive province of specialist analysts huddled over SQL consoles. Today, selfservice businessintelligence (BI) platforms are turning that closed shop into an open marketplace where marketers, product owners and even frontline staff can explore information independently. By pairing intuitive visualquery builders with governed data models, these tools let organisations answer daytoday questions without adding to IT backlogs. As adoption accelerates, leaders face a pivotal challenge: encouraging widespread empowerment while maintaining accuracy, security and strategic alignment.
The SelfService BI Philosophy
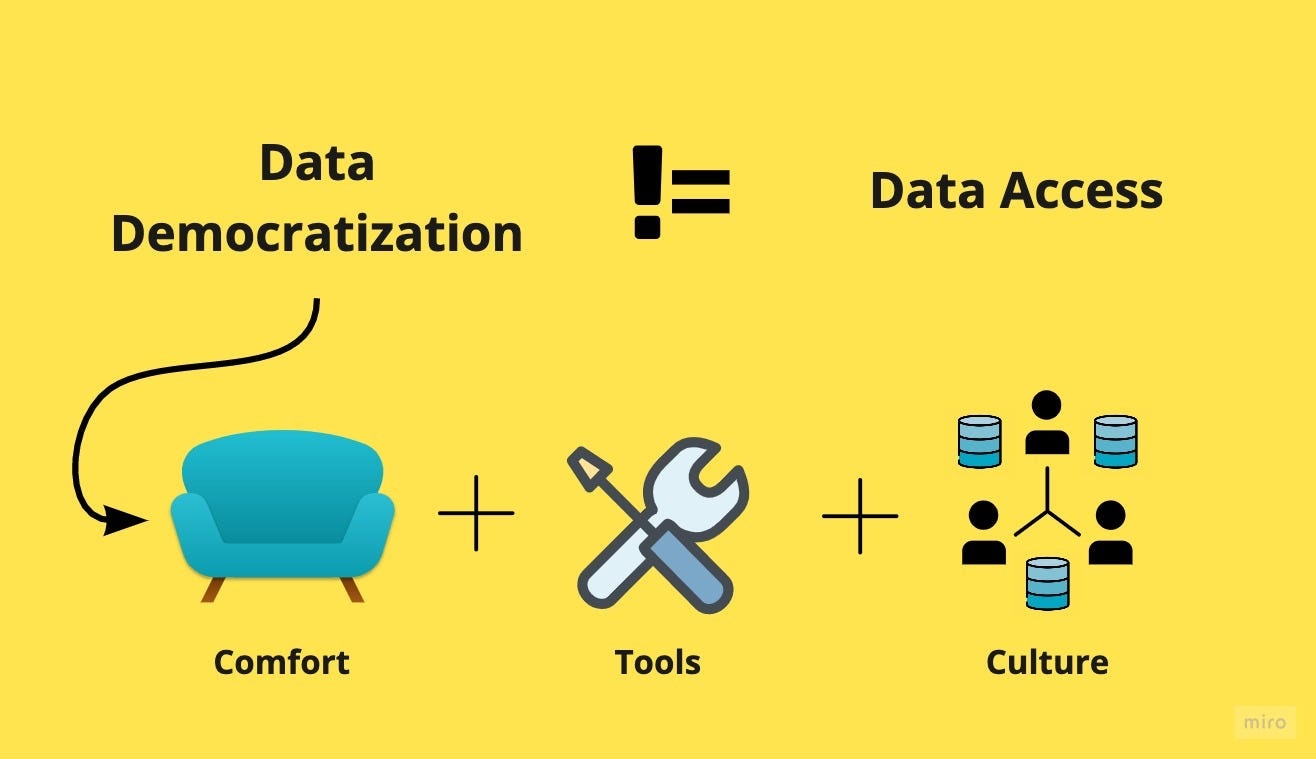
At its heart, selfservice BI rests on a simple premise—put the right data in the hands of the people closest to the decision. Sales managers should be able to slice pipeline metrics on the fly, and HR partners ought to analyse hiring funnels without waiting weeks for a dashboard. Achieving that ideal entails three pillars: accessible interfaces, trustworthy data foundations and a culture that values curiosity as much as compliance.
Enabling Technologies and Features
- DragandDrop Dashboards – Modern BI suites feature canvasstyle editors where users select dimensions and measures from a sidebar, then drag them onto visual shelves. Autosuggested chart types reduce guesswork.
- NaturalLanguage Query (NLQ) – Typing “Show me monthly revenue for the NorthWest region” triggers the engine to translate plain English into SQL, returning a live chart.
- Augmented Analytics – AI modules detect outliers, forecast trends and surface key drivers, guiding nontechnical users towards insightful angles.
- Semantic Layer – A governed data model standardises definitions—what exactly constitutes ‘active customer’—so different departments speak the same language.
- RoleBased Security – Rowlevel filters ensure finance staff do not see HR salaries, yet both groups work from the same underlying tables.
From Centralised to Federated Analytics
Traditional BI followed a hubandspoke model: data engineers built warehouses, wrote reports and distributed PDFs. Selfservice flips that paradigm. Central teams now curate reusable datasets, while domain experts create and share dashboards. Crucially, success depends on a strong enablement programme. Lunchandlearn sessions, office hours and microcredential pathways—such as an intensive data analyst course—equip business users with statistical literacy so they can spot when a bar chart is misleading or a correlation spurious.
Why Pune Is Emerging as a SelfService BI Hotbed
Pune’s blend of multinational IT campuses and vibrant startup culture makes it fertile ground for datademocratisation experiments. Local firms adopt BI tools early, then refine rollout playbooks that later scale to global offices. Meanwhile, talent pipelines continue to strengthen. A projectbased data analyst course in Pune immerses learners in live deployments at fintech incubators, teaching them how to model dimensions, configure access policies and run adoption workshops. Graduates enter the workforce primed to champion selfservice analytics across varied sectors.
Balancing Freedom with Governance
The biggest fear surrounding selfservice BI is the “wildwest dashboard” problem: multiple versions of the truth proliferate, and executives cannot trust numbers. Governance frameworks mitigate the risk. Central data stewards certify datasets, define KPIs and monitor lineage. Alert systems flag duplicated formulas, and changemanagement boards approve metric modifications. Training remains vital; completing a data analytics course helps champions understand aggregation pitfalls, ensuring sound methodology even in adhoc explorations.
Key Metrics for Evaluating Success
- Adoption Rate – Percentage of employees logging into BI tools weekly.
- TimetoInsight – Median minutes between a question arising and its answer.
- IT Ticket Volume – Reduction in report requests postdeployment.
- Data Quality Issues – Frequency of metric disputes in steeringcommittee meetings.
- Business Outcomes – Revenue uplift, cost savings or customersatisfaction gains attributed to insights.
Dashboards tracking these metrics create a feedback loop, guiding enablement priorities and platform investment.
Cultural Shifts and Change Management
Selfservice BI thrives in environments that celebrate experimentation. Leaders must signal that it’s acceptable to ask “naïve” questions and iterate. Gamified learning portals, internal hackathons and peer recognition programmes nurture curiosity. Conversely, punitive reactions to honest mistakes stifle exploration. Mentorship—pairing novice explorers with experienced analysts—accelerates skill acquisition and embeds best practice.
Common Roadblocks (and Remedies)
- Analysis Paralysis – A smorgasbord of charts can overwhelm newcomers. Solution: offer starter templates aligned to common use cases.
- Data Literacy Gap – Users misinterpret pvalues or seasonal effects. Remedy: sponsor microcourses and lunchtime seminars.
- Performance Bottlenecks – Large joins slow down dashboards. Fix: implement caching layers and aggregate tables.
- Shadow IT – Teams duplicate extracts locally. Countermeasure: central auditing and clear storage quotas.
- Security Concerns – Sensitive columns leak via downloads. Mitigation: watermark exports, enforce MFA and monitor audit logs.
The Future: BI Meets Generative AI
Largelanguage models promise voiceactivated insights. Imagine vocalising “Compare yearonyear growth for our top three regions” and watching the dashboard update, plus receiving a narrative summary: “APAC grew 12 %, largely driven by electronics; EMEA dipped 3 % due to currency headwinds.” Such capabilities will lower barriers further, making data inquiry as natural as conversation.
Explainability tools will accompany this ease: autogenerated footnotes cite data sources, measurement periods and statistical confidence, preempting disputes. Meanwhile, realtime pipelines will push sensor and IoT metrics directly into BI layers, shrinking the latency between observation and action.
Sustaining Momentum
Postlaunch enthusiasm often wanes. To maintain engagement:
- Establish Communities of Practice – Monthly showcases where teams present insights and lessons.
- Rotate Ownership – Encourage departments to nominate BI champions, spreading expertise.
- Celebrate Wins – Highlight decisions derived from dashboards in townhall meetings.
- Iterate – Regularly refresh data models to include new sources as strategies evolve.
Survey data shows organisations with active user groups report 35 % higher insight adoption compared with those relying solely on email updates.
Ethical and Legal Responsibilities
As more employees access data, safeguarding privacy and avoiding bias become paramount. Differential privacy techniques can add statistical noise to sensitive metrics. Rolebased anonymisation hides smallcell counts that might expose individuals. Governing boards review dashboard proposals for compliance with GDPR and ESG commitments before publication.
Conclusion
Selfservice BI is democratising data, pushing analytical power to the edge of the organisation where decisions happen fastest. When paired with strong governance and a learning culture, it fuels smarter actions without compromising accuracy. Investment in education—whether a modular course for budding champions or a handson data analysis course in Pune for regional talent—ensures employees possess the skills to explore responsibly. In an era where agility defines competitiveness, enabling everyone to interrogate data may prove the most strategic move a business can make.
Business Name: ExcelR – Data Science, Data Analyst Course Training
Address: 1st Floor, East Court Phoenix Market City, F-02, Clover Park, Viman Nagar, Pune, Maharashtra 411014
Phone Number: 096997 53213
Email Id: enquiry@excelr.com